Inspired by Victor Davis Hansen, who wrote an article about California potentially having the virus for months, I decided to see if there is a resemblance in the data being reported that would support his theory.
First, according to the California Influenza Surveillance Program (the California Department of Health), starting in early December, there were “above expected levels” of influenza-like illnesses (ILI) reported by Sentinel and pneumonia and influenza (P&I) admissions reported by Kaiser Permanente in North California Hospitals:


Interestingly, the report classifies
- ILI – “any illness with fever (≥100°F or 37.8°C) AND cough and/or sore throat (in the absence of a known cause other than influenza).”
- P&I – “pneumonia and influenza admissions serve as a proxy for influenza activity, but do not necessarily represent laboratory-confirmed influenza infections.”
Both spikes could have been Chinese Coronavirus, but given the symptoms are similar to the flu and the United States was not testing for this virus, it would be dumped into the ILI and P&I buckets.
If the virus has been in California since December, why hasn’t the state experienced a breakout similar to New York City? That could be explained by population density to an extent, but if that is the case why isn’t Los Angeles more like Detroit?
The following charts, all set to the same scale, show the daily high temperature for the largest city / metro area, and the “cases per million per day”. It is obvious, the higher the temperature, the lower the case rate.
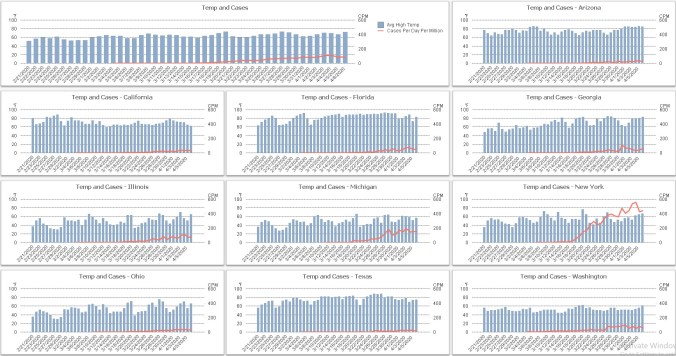
If you don’t trust the extent of testing being done and think “cases per million per day” might not be the best way to judge (we haven’t tested everyone who might have the virus), looking at the “deaths per day per million” shows an even greater contrast.

If the virus started in New York, you could argue that it is ready to explode in those other states, but then it is puzzling, why would Michigan start its climb before Florida? Florida gets far more New York travelers than Michigan (especially this time of year, who would want to vacation in Detroit?).
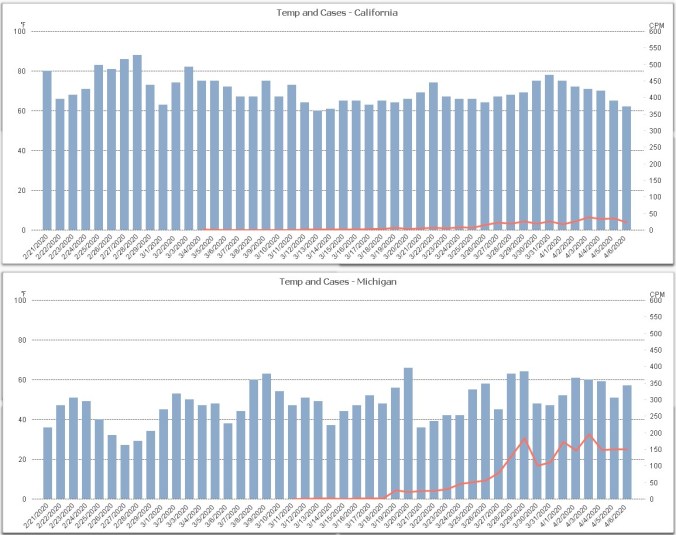
Since those charts are hard to see, here are larger views of California vs Michigan.
Temperature and Cases
Temperature and Deaths
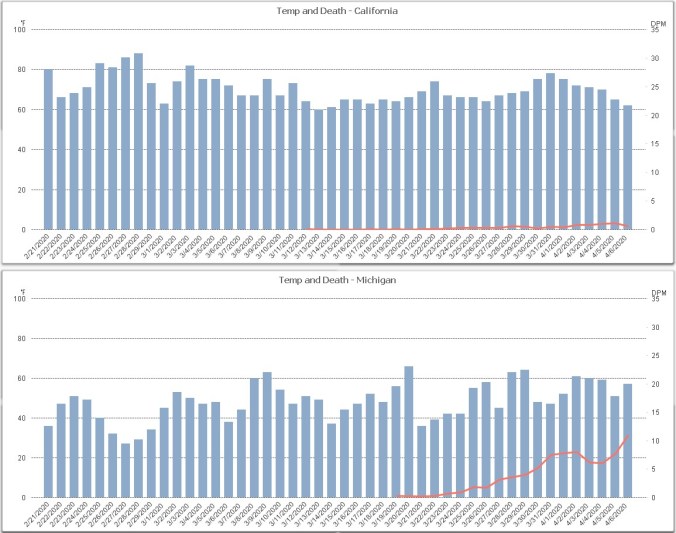
California’s reported 53 cases on March 4th, Michigan didn’t report any until March 11. California’s first death also was reported before Michigan’s (March 12 vs March 19). California’s lock down went into affect on March 19th, 7 days after the first deaths were reported, Michigan went into lock down on March 24th, 5 days after their first death.
Shouldn’t California’s numbers at least resemble the Michigan data?
Going back to the list of states I compared: Grouping those states together, there are some interesting things to note. The average high temperature from February 21 to April 6 for Illinois, Michigan, Ohio, and Washington were under 60 degrees, for the other states in my list, the average high temperature was above 60 (New York, an “under 60 average” state is not included in the below chart to prevent “skewing” the charts in favor of my argument):
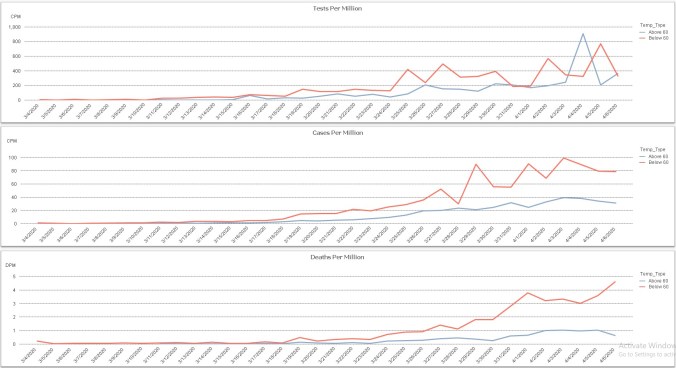
Remember, these charts exclude New York. Notice:
- In both cool and warm states, the tests per million grew at similar rates, meaning they are all testing roughly the same % of their population
- For cool states, as the testing capabilities improve, the “cases per million” and the “deaths per million” both continue to grow, indicating the virus is spreading faster
- The warm states have the opposite, even though the testing capabilities are improving, the cases and deaths have leveled off, or in some instances they are declining
- The difference between the two lines (either in cases or deaths per million) was never the same, but as more people are tested, the difference obvious
All this suggests two things: the virus is much less harmful in warmer climates (and hopefully in the summer everywhere) and California has already “peaked”.
