John McCain (2008) vs Mitt Romney (2012) vs Donald Trump (2016)
The following analysis will show that Trump is doing as well or better than the previous GOP “presumptive” nominees at this stage in the game.
Things change over each election cycle, so comparing apples to apples is never 100%. There are several factors that need to be considered to compare voter turnout, delegate counts, state by state comparisons, etc., this analysis by no means accommodates everything to make it a completely fair comparison, but it is good enough to make some conclusions on.
First, the “Heavy Heights” or “Viable Candidates” in a race. I am taking into consideration when the first one dropped out, and how many elections took place before the drop out.
- 2008: On February 7th Romney drops out after 27 contests
- 2012: On April 4th Santorum drops out after 32 contests
- 2016: On March 16th 2016 Rubio drops out after 32 Contests
Another factor is that the same states did not vote within the same time frame of the first heavy weight candidate to dropout, e.g. in 2008 California voted on February 5th, giving John McCain over a million votes. California has not yet voted in 2016 and did not vote until June 5th in 2012 (after Santorum and Gingrich dropped out).
These numbers include the following for each election:
- 2008: The 1st 34 contests, all states that voted from the start of the election through 2/15/2008 (minus California)
- 2012: The 1st 35 contests, all the states that voted from the start of the election through 4/24/2008 (minus New York and Pennsylvania)
- 2016: The 1st 33 contests, all the states that voted from the start of the election through 3/22/2016
In addition to those notes, there are changes to the number of delegates needed to get the nomination:
- 2008 – needed 1191 delegates (~5% less than 2016)
- 2012 – needed 1141 (~8% less than 2016)
- 2016 – need 1237
Finally, the last factor to point out is population change. The approximate population of the United States in 2014 was 318M. Using a 4 year increment (elections are every four years), there were roughly 308M in 2010 (~3% less than 2014) and 292M in 2006 (~8% less than 2014). Those are not scientific calculations, but good enough to normalize the data for this analysis.
With these clarifications and explanations, let’s look at how the three front runners stacked up against each other, based on the first 35 or so states that voted (described in bullets above).
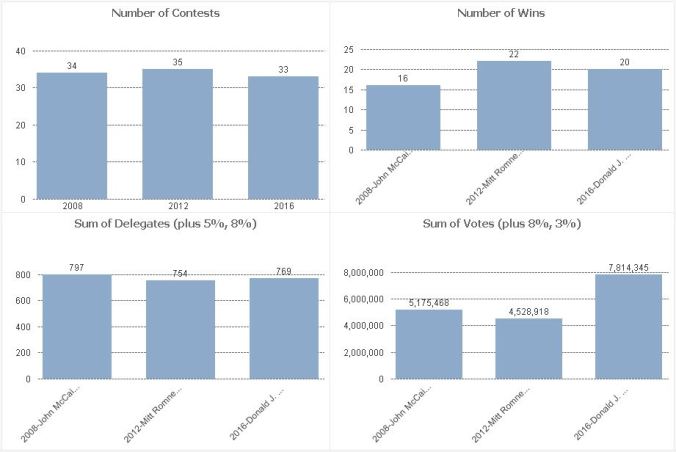 The first chart (top left) is simply showing the number of races completed, based on the explanation above.
The top right chart shows the number of victories per candidate. Notice despite less races Trump has more wins than McCain did at this stage, and is only 2 behind Romney, which happens to be the same difference between the total contests being considered between the two.
The bottom left chart shows the delegate count per candidate (adjusted for inflation according to the bullet points above). Again, all the numbers are similar, despite Trump having less total contests than the other two in this analysis.
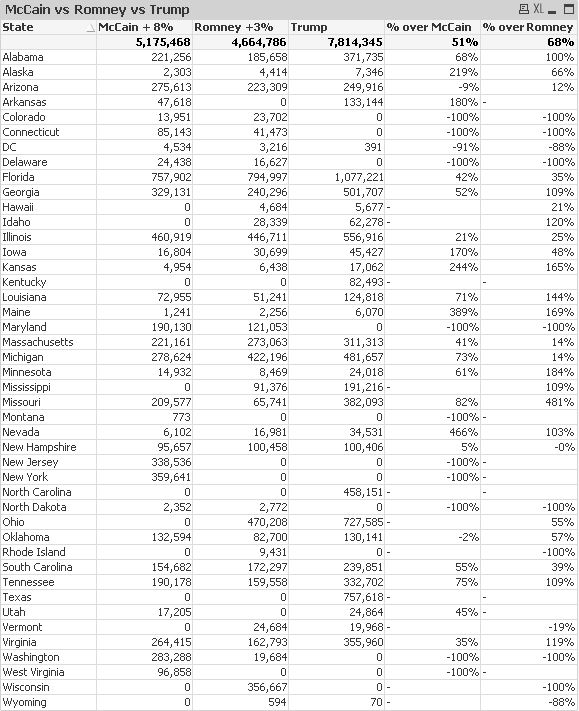
The biggest story is the bottom right chart, “Sum of Votes”. 8% was added to McCain and 3% to Romney for population growth, and Trump still smashes both of them by 51% and 68% respectively. In fact there are only four individual contests where McCain or Romney beat Trump in the popular vote:
- Arizona – McCain had 9% more than Trump, the home state politician factor, which is similar to Ted Cruz and his Texas victory, which I talk about here: Can Cruz Win?
- Wyoming, which was some sort of state convention (RNC establishment hacks)
- DC, both McCain (4500 votes) and Romney (3200 votes) beat Trump (391 votes) in DC!
- McCain also got more in Oklahoma than Trump, but that was only by 2%
Everything else, Trump wins, and usually big time, as is reflected in the total votes: Trump 7.8M, Romney 4.5M, McCain 5.2M.
The conclusion is that Trump is doing as well, if not better than Romney and McCain when the media was trumpeting them as the nominee. Although the comparison is not 100%, there is no reason to assume Trump is a weak candidate, and arguably what the “dying” Republican Party needed. It is obvious that the political class is not afraid of the party dying or of Hillary winning, but of Trump and how he would shake things up, otherwise they would have embraced the energy he brought to their little party.
For additional details, the states included in this calculation are as follows, blanks mean the state did not vote within the date windows or was omitted for reasons I described above:

Pingback: Who Was a Stronger Candidate Donald Trump or Mitt Romney? | whatthedatasays
Pingback: How Donald Trump Wins With No Contested Convention | whatthedatasays